


INTRODUCING The Saddik Self-Funding Security Index (S3I):
A new tool to better evaluate the risk
In recent years, Self-Funding has gained popularity in Group insurance even for smaller and medium size groups. In fact, at plan review time, self-funding is often considered as an interesting alternative to fully insured group health and dental plans and is now part of regular plan reviews exercises. To that effect, Saddik International has designed the S3I index (Saddik Self-Funding Security Index ) in order to give financial advisors and corporate decision makers a neutral actuarial tool to help making the right decision.
What is the S3I index and how can it be interpreted?
The S3I is a composite risk index varying from 0 to 100 based on the annual claims frequency distribution of aggregate claims for a given group. It gives no weight to outcomes that exceeds expected claims by less than 0.5% of payroll, lower weights to mild negative outcomes and exponentially higher weights to more severe outcomes. It varies depending on which Individual Stop-Loss (ISL) level is chosen.
An index value of less than 70 would represent a red zone where self-funding would be discouraged for a specific group. An index value of 90 or more would be the green zone, where self-funding would be suitable.
Anything between 70 and 90 would be the yellow zone, where a self-funded solution may or may not represent a suitable solution and where additional elements would need to be considered such as the financial situation of the plan sponsor and the medium and long term planning (for example plans for expansion, acquisition or divestiture or even market exit.
In addition to self-funding most of the risk, an employer must be ready take on additional administration and accounting functions such as benefit design review, taxable income recognition that varies per utilization, cashflow budgeting and liability recognition of IBNRs in financial statement. Some of these functions might however be outsourced.
The knowledge of a person insured with an ongoing medical condition requiring recurrent medical expenditures should also influence any decision for or against self-funding although this may not always be known due to PIPEDA or other provincial privacy legislation.
Examples (see attached graphs):
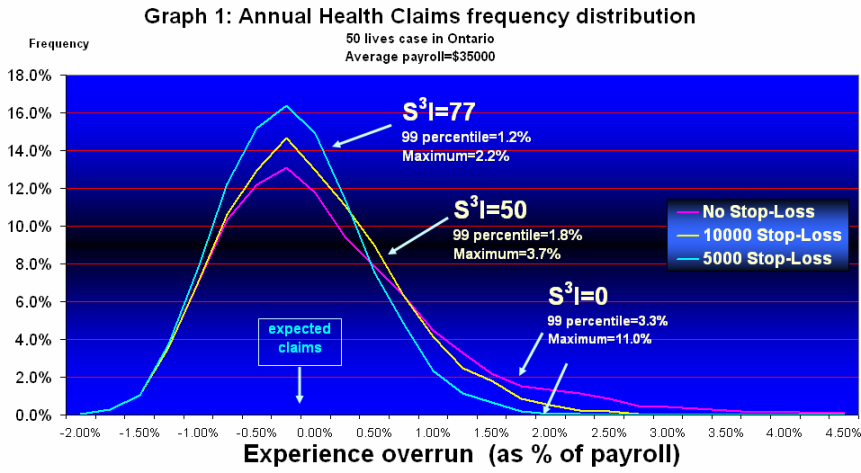
A specific group of 50 lives in Ontario where the average payroll is $35000 illustrated in the graph 1 would have a S3I of 0 without any ISL, 50 with an ISL of $10000 and 77 with an ISL of $5000.
That means that if the group would ever consider self-funding, that it should contract out an insurance protection of an amount no greater than $5000. An even then, it should be prepared to assume an extra cashflow risk equivalent to 1.2% of its payroll once every 100 years and up to 2.2% in realistic worst case scenarios.
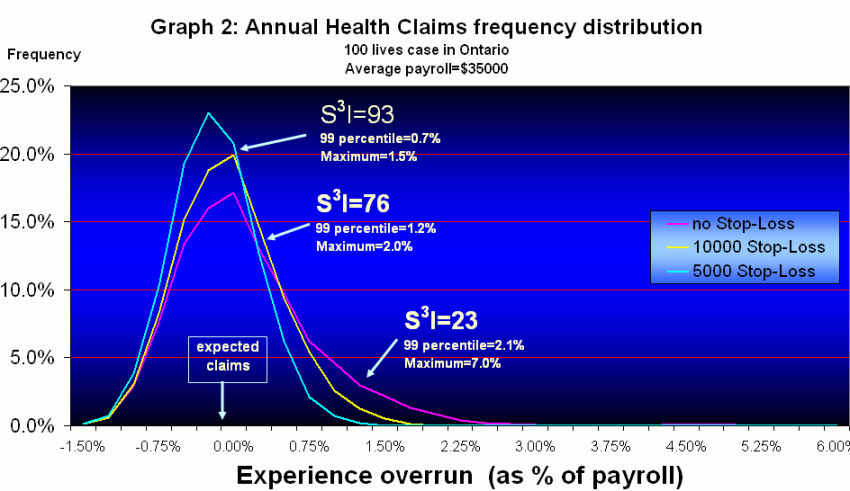
If the same group would have 100 lives instead (illustrated in the graph 2), the resulting S3I would be 23 without any ISL, 76 with an ISL of $10000 and 93 with an ISL of $5000.
That would mean that the group not only would have no problem self-funding with an ISL of $5000 but it could even stretch its risk-bearing to $10000 per person as long as it was able to stomach a claim overrun equivalent to 1.2% of payroll once in a 100 year and 2% of payroll once in 10 000 years.
The tool is not designed to promote whether a plan sponsor deciding to self-fund should choose either an insurer or an independent TPA as claims administrator.
It is also important to emphasize that no fully-funded solution would be acceptable without a suitable ISL protection with a recognized insurer.
Who can get it and how much does it cost?
The S3I tool is available only to Group financial advisors for a modest investment of $350 For groups less than 200 lives and $500 for groups 200 lives or over. It is expected that advisors with groups of anywhere from 50 lives to 300 lives might consider the S3I tool at plan review either to maintain its group clients or to acquire new clients.
A new tool to better evaluate the risk
In recent years, Self-Funding has gained popularity in Group insurance even for smaller and medium size groups. In fact, at plan review time, self-funding is often considered as an interesting alternative to fully insured group health and dental plans and is now part of regular plan reviews exercises. To that effect, Saddik International has designed the S3I index (Saddik Self-Funding Security Index ) in order to give financial advisors and corporate decision makers a neutral actuarial tool to help making the right decision.
What is the S3I index and how can it be interpreted?
The S3I is a composite risk index varying from 0 to 100 based on the annual claims frequency distribution of aggregate claims for a given group. It gives no weight to outcomes that exceeds expected claims by less than 0.5% of payroll, lower weights to mild negative outcomes and exponentially higher weights to more severe outcomes. It varies depending on which Individual Stop-Loss (ISL) level is chosen.
An index value of less than 70 would represent a red zone where self-funding would be discouraged for a specific group. An index value of 90 or more would be the green zone, where self-funding would be suitable.
Anything between 70 and 90 would be the yellow zone, where a self-funded solution may or may not represent a suitable solution and where additional elements would need to be considered such as the financial situation of the plan sponsor and the medium and long term planning (for example plans for expansion, acquisition or divestiture or even market exit.
In addition to self-funding most of the risk, an employer must be ready take on additional administration and accounting functions such as benefit design review, taxable income recognition that varies per utilization, cashflow budgeting and liability recognition of IBNRs in financial statement. Some of these functions might however be outsourced.
The knowledge of a person insured with an ongoing medical condition requiring recurrent medical expenditures should also influence any decision for or against self-funding although this may not always be known due to PIPEDA or other provincial privacy legislation.
Examples (see attached graphs):
A specific group of 50 lives in Ontario where the average payroll is $35000 illustrated in the graph 1 would have a S3I of 0 without any ISL, 50 with an ISL of $10000 and 77 with an ISL of $5000.
That means that if the group would ever consider self-funding, that it should contract out an insurance protection of an amount no greater than $5000. An even then, it should be prepared to assume an extra cashflow risk equivalent to 1.2% of its payroll once every 100 years and up to 2.2% in realistic worst case scenarios.
If the same group would have 100 lives instead (illustrated in the graph 2), the resulting S3I would be 23 without any ISL, 76 with an ISL of $10000 and 93 with an ISL of $5000.
That would mean that the group not only would have no problem self-funding with an ISL of $5000 but it could even stretch its risk-bearing to $10000 per person as long as it was able to stomach a claim overrun equivalent to 1.2% of payroll once in a 100 year and 2% of payroll once in 10 000 years.
The tool is not designed to promote whether a plan sponsor deciding to self-fund should choose either an insurer or an independent TPA as claims administrator.
It is also important to emphasize that no fully-funded solution would be acceptable without a suitable ISL protection with a recognized insurer.
Who can get it and how much does it cost?
The S3I tool is available only to Group financial advisors for a modest investment of $350 For groups less than 200 lives and $500 for groups 200 lives or over. It is expected that advisors with groups of anywhere from 50 lives to 300 lives might consider the S3I tool at plan review either to maintain its group clients or to acquire new clients.
Saddik Self-Funding Security Index (S3I) graphs examples:
Language
What kind of report will I get?
The evaluation will be forwarded to you electronically within 3-4 business days along with a professionally tailor-made actuarial report containing itself as well as a graph and a series of indicators for the likelihood of exceeding pre-determined claims thresholds (expressed as percentage of total payroll) in any given year. Please click here for sample report.
The evaluation will be forwarded to you electronically within 3-4 business days along with a professionally tailor-made actuarial report containing itself as well as a graph and a series of indicators for the likelihood of exceeding pre-determined claims thresholds (expressed as percentage of total payroll) in any given year. Please click here for sample report.
(PDF 1.9 MB)